What's new
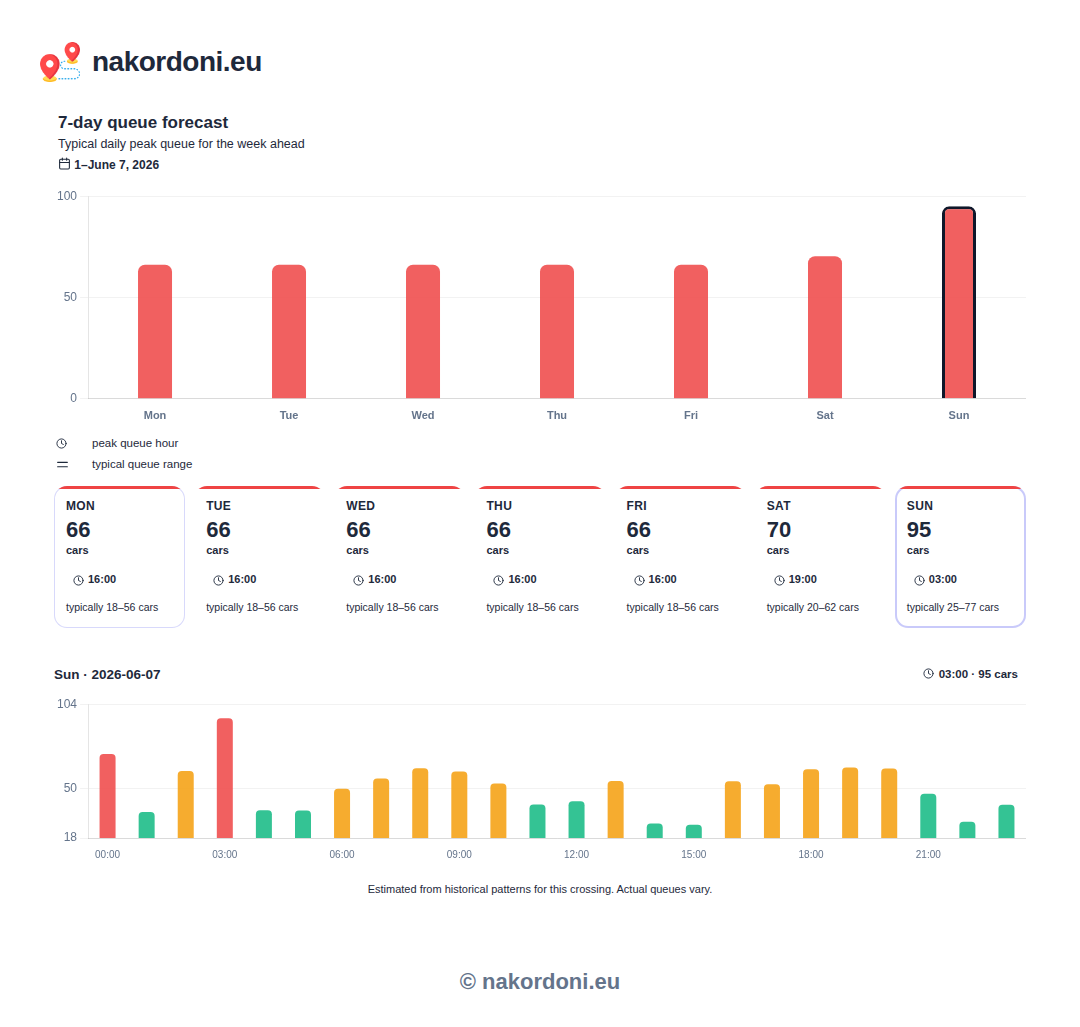
Every checkpoint page on the Ukraine – Poland border now shows a 7-day queue forecast. It is the typical daily peak queue for the week ahead: for each day you see the expected number of cars, the peak hour, and the queue range. Below is an example for the Krakovets crossing.
How to see the forecast for any crossing
Open the page of the checkpoint you need and press the "See the 7-day forecast" button under the queue chart. The weekly forecast opens with daily peaks; tap any day to see a detailed 24-hour hourly chart.
The forecast is built from the historical pattern of that specific crossing using the Nakordoni queue-prediction model. Actual queues can vary, so always check the live data before you travel.
- Best crossing finder — real-time queue comparison
- Route navigator — driving route with live traffic and toll cost
- European holidays calendar — dates that historically shift border load
Forecast generated by nakordoni.eu from official border data and the Nakordoni queue-prediction model.