
| כתובת בסיס | https://nakordoni.eu/api/v1/data/ |
|---|---|
| פורמט | JSON, UTF-8 |
| אימות | Authorization: Bearer NKD-DEV-… |
| ניהול גרסאות | גרסאות בנתיב ולכל endpoint בנפרד: /api/v1/… יציב והתשובות שלו לעולם אינן משתנות. נתיב גרסה גבוה יותר (/api/v2/…, /api/v4/…) מספק את ההתנהגות החדשה רק עבור ה-endpoints שהשתנו, ולשאר חוזר באופן שקוף לגרסה שמתחת. כל מוצר מציג את הגרסה הגבוהה ביותר שהוא מתעד — כוונו אליה, לא להערה הזו. אם גרסה חדשה יותר מחליפה את זו שהמפתח שלך קורא לה, אנחנו שולחים לך אימייל ומציגים הודעה בפורטל המפתחים — אין צורך לגלות זאת מיומן השינויים. |
בעמוד הזה
אימות
כל בקשה דורשת את מפתח ה־API שלכם בכותרת Authorization (מומלץ) או כפרמטר ?key=.
curl "https://nakordoni.eu/api/v1/data/queue?ppid=id_13" \
  -H "Authorization: Bearer NKD-DEV-XXXX-XXXX-XXXX"
מבנה התגובה
{
  "ok": true,
  "api_version": "v1",
  "product": "queue",
  "attribution": "Data by nakordoni.eu",
  "terms": "https://nakordoni.eu/en/p/developer_api_terms",
  "data": { ... },
  "usage": { "limit": 1000, "used": 42, "reset": "2026-06-06T00:00:00Z" }
}
שגיאות מחזירות ok:false עם error.code (missing_api_key, invalid_api_key, qps_exceeded, quota_exceeded, unknown_product, product_unavailable, not_approved, bad_request, duplicate_request, market_not_allowed, internal_error, status_unavailable, timeout) וסטטוס HTTP 400/401/403/404/429/500/503/504. כותרות ה־rate limit — X-Devapi-Limit ו־X-Devapi-Remaining — נשלחות בכל תגובה שנספרת במכסה. ok:false הוא הקובע — לעולם אל תקראו את data בקריאה שנכשלה. אובייקט usage קיים בכל מוצר מחויב; /status ציבורי ואינו מחויב, ולכן אינו מחזיר usage.
מכסות
| Explorer | |
|---|---|
| קריאות ביום ל־API הנתונים הסטנדרטיים | 1,000 |
| קריאות ביום ל־API התחזיות והסטטיסטיקה | 200 |
| קריאות מסלול משאיות ליום | 10 |
| QPS | 2 |
המונים היומיים מתאפסים בחצות לפי UTC. תקבלו אימייל בהגעה ל־80% ול־100% מהמכסה.
תוכניות בתשלום מעלות כל אחת מהמגבלות האלה. התוכניות הנוכחיות והמכסות שלהן: תוכניות
דוגמאות קוד
curl
curl "https://nakordoni.eu/api/v1/data/queue?ppid=id_13" \
  -H "Authorization: Bearer $NKD_API_KEY"
JavaScript (fetch)
const res = await fetch('https://nakordoni.eu/api/v1/data/forecast?ppid=id_13&prediction_steps=24', {
  headers: { Authorization: `Bearer ${process.env.NKD_API_KEY}` }
});
const { ok, data, error, usage } = await res.json();
if (!ok) throw new Error(error?.code ?? res.status);
console.log(`forecast points: ${data.length}, calls left today: ${usage.limit - usage.used}`);
Python (requests)
import os, requests

r = requests.get(
    "https://nakordoni.eu/api/v1/data/stats",
    params={"ppid": "id_15", "compare": 1},
    headers={"Authorization": f"Bearer {os.environ['NKD_API_KEY']}"},
    timeout=15,
)
payload = r.json()
print(payload["data"]["daily"], payload["usage"])
Excel (Power Query)
משכו נתוני תור, תחזית או איסורי משאיות ישירות לחוברת עבודה עם מחבר ה-JSON המובנה של Power Query — בלי קוד, עם רענון מתוזמן. אותה תבנית Headers עובדת עבור כל מוצר ב-API הזה — רק צריך להחליף את ה-URL.
Data → Get Data → From Other Sources → Blank Query, then Home → Advanced Editor and paste:
let
    ApiKey = "NKD-DEV-XXXX-XXXX-XXXX",
    Source = Json.Document(Web.Contents("https://nakordoni.eu/api/v1/data/queue",
        [Query = [ppid = "id_13"], Headers = [Authorization = "Bearer " & ApiKey]])),
    data = Source[data],
    AsTable = Record.ToTable(data)
in
    AsTable
שמרו את מפתח ה-API בתוך שאילתת ה-M (Home → Advanced Editor), לא בתא בגיליון — Power Query חוסם בקשת רשת שנבנתה משאילתה או תא אחר ("Formula.Firewall"), אלא אם רמת הפרטיות מוגדרת כ-Organizational.
כמה מעברי גבול בטבלה אחת (לוחות בקרה לצי רכבים) — e.g. every truck crossing UA→PL (crossing_type=9; in v3 that one code covers both freight lanes):
let
    ApiKey = "NKD-DEV-XXXX-XXXX-XXXX",
    Source = Json.Document(Web.Contents("https://nakordoni.eu/api/v4/data/border/1/2/9",
        [Headers = [Authorization = "Bearer " & ApiKey]])),
    checkpoints = Source[data],
    AsTable = Table.FromRecords(checkpoints)
in
    AsTable
Data → Refresh All ב-Excel, או רענון מתוזמן ב-Power BI / Excel Online, שומר על נתונים עדכניים — בלי קוד polling.
אינטגרציה עם ERP (BAS / BAF ופלטפורמות ממשפחת 1C)
BAS / BAF ופלטפורמות אחרות ממשפחת 1C יכולות לקרוא ל-API הזה ישירות ממשימה מתוזמנת — HTTPConnection יחד עם ReadJSON, בלי שכבת ביניים ובלי שירות נוסף לתחזק. התצורה הנפוצה ביותר מחזיקה מרשם מידע מעודכן של מחירי דלק באיחוד האירופי.
רענון מרשם מידע (מחירי דלק, כל המדינות בקריאה אחת)
// Scheduled job — runs once a day
Connection = New HTTPConnection("nakordoni.eu", 443, , , , 30, New OpenSSLSecureConnection);

Headers = New Map;
Headers.Insert("Authorization", "Bearer NKD-DEV-XXXX-XXXX-XXXX");

Request  = New HTTPRequest("/api/v1/data/fuel", Headers);
Response = Connection.Get(Request);

Reader = New JSONReader;
Reader.SetString(Response.GetBodyAsString("UTF-8"));
Answer = ReadJSON(Reader, True);
Reader.Close();

If Answer["ok"] <> True Then
    // Answer["error"]["code"] says why; Answer["usage"] holds your quota state
    Return;
EndIf;

For Each Row In Answer["data"] Do
    Record = InformationRegisters.FuelPrices.CreateRecordManager();
    Record.Period   = CurrentSessionDate();
    Record.Country  = Row["country"];    // "PL", "DE", "SK", "RO", ...
    Record.Diesel   = Row["diesel"];
    Record.Petrol   = Row["petrol"];
    Record.LPG      = Row["lpg"];
    Record.Currency = Row["currency"];
    Record.Write();
EndDo;
שלושה דברים שחשוב לדייק בהם: העבירו New OpenSSLSecureConnection דרך פורט 443, אחרת הבקשה תיפול על TLS; קראו ל-/api/v1/data/fuel בלי הפרמטר country כדי שבקשה אחת תחזיר את כל המדינות במקום קריאה לכל מדינה; ובדקו את ok לפני שנוגעים ב-data — כשלים חוזרים כ-ok:false עם error.code, לא כחריגה. הדוגמה משתמשת בסט מילות המפתח האנגלי של הפלטפורמה; המקבילות המתורגמות (HTTPСоединение, ПрочитатьJSON, РегистрыСведений) פועלות באופן זהה.
מחירי הדלק במקור משתנים פעם ביום, ולכן משימה מתוזמנת פעם או פעמיים ביום מספיקה ונשארת הרחק בתוך המכסה החינמית של Explorer. נתוני התורים החיים (queue, multi, border) משתנים כל כמה דקות — תשאלו אותם בקצב משלכם והשתמשו ב-multi כדי לקרוא עד 5 מעברי גבול בבקשה אחת במקום בלולאה.
שרת MCP
מעדיפים קריאה לכלים במקום REST? אנחנו מפעילים שרת MCP אמיתי (תעבורת Streamable HTTP) שחושף תת-קבוצה בטוחה וניתנת לקריאה בלבד של ה-API הזה ככלי MCP — אותו מפתח API, אותה מכסה, רק תעבורה שונה.
Endpoint: https://nakordoni.eu/mcp · Server card: /.well-known/mcp/server-card.json
get_api_status      — no key required
list_checkpoints     — country, lang
get_border_queue     — origin, destination, crossing_type, lang
get_live_queue       — ppid, lang
get_queue_forecast   — ppid, prediction_steps
הגדרת לקוח (Claude Desktop / Claude Code):
{
  "mcpServers": {
    "nakordoni": {
      "url": "https://nakordoni.eu/mcp",
      "headers": { "Authorization": "Bearer NKD-DEV-XXXX-XXXX-XXXX" }
    }
  }
}
Country and vehicle-type codes
Border endpoints address countries and vehicle types by numeric id: /api/v1/data/border/{origin}/{destination}/{crossing_type}. destination also accepts a comma-separated list or the word all. The ids are stable and are the same in every product that takes an origin, a destination or a crossing_type.
Country ids
The border products accept the ids marked as origins below; the neighbours column is what destination=all expands to for that origin. Ids without neighbours are countries we name in responses but hold no crossings for yet. The Checkpoints Directory returns the origin, destination and crossing_type of every crossing we actually serve, so it stays the authoritative list.
| id | Country | Borders with (destination ids) |
|---|---|---|
1 |
אוקראינה | 2, 3, 4, 5, 6, 7 |
2 |
פולין | 1, 7, 18 |
3 |
סלובקיה | 1 |
4 |
הונגריה | 1, 5, 13 |
5 |
רומניה | 1, 4, 6, 12, 13 |
6 |
מולדובה | 1, 5 |
7 |
בלארוס | 1, 2, 8, 9 |
8 |
ליטא | 7 |
9 |
לטביה | 7 |
11 |
סלובניה | 16, 20 |
12 |
בולגריה | 5, 13, 14, 15, 19 |
13 |
סרביה | 4, 5, 12, 15, 16, 17, 22, 23 |
14 |
טורקיה | 12, 19 |
15 |
מקדוניה הצפונית | 12, 13, 19, 21, 23 |
16 |
קרואטיה | 11, 13, 17, 22 |
17 |
בוסניה והרצגובינה | 13, 16, 22 |
18 |
גרמניה | 2 |
19 |
יוון | 12, 14, 15, 21 |
20 |
איטליה | 11 |
21 |
אלבניה | 15, 19, 22, 23 |
22 |
מונטנגרו | 13, 16, 17, 21, 23 |
23 |
קוסובו | 13, 15, 21, 22 |
24 |
אוסטריה | — |
25 |
צ׳כיה | — |
26 |
צרפת | — |
27 |
ספרד | — |
28 |
הממלכה המאוחדת | — |
29 |
הולנד | — |
30 |
בלגיה | — |
31 |
פורטוגל | — |
33 |
אסטוניה | — |
34 |
שווייץ | — |
35 |
דנמרק | — |
36 |
פינלנד | — |
37 |
לוקסמבורג | — |
38 |
נורווגיה | — |
39 |
שוודיה | — |
Vehicle types (crossing_type)
| id | Vehicle type | Accepted by /border/ |
|---|---|---|
4 |
רכב פרטי | ✔ |
5 |
רכב פרטי Tax Free | ✔ |
6 |
אוטובוס | ✔ |
7 |
הולכי רגל | ✔ |
8 |
משאיות | ✔ |
9 |
משאיות עד 7.5 טון | ✔ |
10 |
מעבורת - רכב פרטי | — |
11 |
מעבורת - אוטובוס | — |
12 |
מעבורת - הולכי רגל | — |
13 |
מעבורת - משאיות | — |
14 |
משאיות עד 3.5 טון | — |
The label in this table is the crossing_type_label the API returns with every response, in the language you request. Types outside the accepted list belong to crossings the directory carries but the border products do not answer for — ferry (10-13), freight up to 3.5 t (14) and rail (15) — and asking for one returns 400, not an empty result. Read crossing_type from the Checkpoints Directory rather than assuming: a crossing returns data only for the types it actually has.
מוצרים
בחרו נקודת קצה כדי לראות את המדריך המלא שלה, הפרמטרים, הגרסאות ו־Sandbox חי.
סטנדרטי נשען על מכסת הנתונים הסטנדרטית · כבד נשען על מכסת התחזיות והסטטיסטיקות — ראה מכסות · מסלול משאיות נגרע ממכסת מסלול המשאיות הייעודית שלו — ראה מכסות
תורים בגבול
מצב בזמן אמת של כל מוצר ב־Developer API: מקוון / מוגבל / מושבת, זמן תגובה ומועד הבדיקה האחרונה, וגם סיכום כללי. ציבורי — לא נדרש …
מדריך של כל מעברי הגבול המנוטרים: מזהים, שמות, מדינות, קואורדינטות וסטטוס. השתמשו בו כדי לגלות ערכי ppid עבור שאר ה־API.
כל מעברי הגבול על גבול נתון + סוג רכב בקריאה אחת — תור בזמן אמת, הערכת זמן המתנה ורעננות נתונים לכל מעבר. תומך ביעד יחיד, ברשימה …
מצאו PPID של מעבר גבול לפי שם, בכל שפה. מחזיר את כל ה־PPID של אותו מקום, מקובצים לפי סוג רכב. עד 20 שמות בכל בקשה.
אורך תור, הערכת זמן המתנה וסטטוס בזמן אמת לכל מעבר גבול מנוטר. כולל בלוק snapshot: התור הנוכחי (queue_now), זמן המתנה חזוי wait_m…
Wait time adjusted for live traffic flow and weather, with a full breakdown of each adjustment, plus the same wait_status/trend f…
קבל את מצב התור ואת טריות הנתונים עבור עד 5 מעברי גבול בבקשה אחת. המכסה נספרת כ-⌈(N PPID × תת-מוצרים) / 2⌉ — זול ב-50% מקריאות בו…
מעברי גבול חלופיים סמוכים על אותו גבול, עם התורים הנוכחיים והפרשי המרחק.
מתי מעבר הגבול עודכן לאחרונה, על ידי איזה מקור, ודירוג רעננות.
תחזיות וסטטיסטיקה
תחזית רמות תור מבוססת אנסמבל ML: אופקים של 24 שעות ושל 7 ימים (168 שעות) עם רווחי סמך. אותו מודל שמניע את התחזיות ב־nakordoni.eu.
סטטיסטיקת תור היסטורית לפי שעה, למעבר גבול ולתאריך: 24 ערכים שעתיים, ממוצע/מינימום/מקסימום יומי, שעות השיא והשעות השקטות, והשוואה…
סטטיסטיקת עומס של שבוע טיפוסי לכל מעבר גבול: מטריצת 7×24 של יום בשבוע × שעה (חציון + טווח p25/p75), היום השקט/העמוס ביותר, וחלונו…
דלק ומיקומים
מחירי דלק במדינות EU — ממוצעים לפי country, תחנות קרובות ביותר לפי קואורדינטות, או תחנות ליד מעבר גבול. מרוכזים ממרשמי מחירים לאו…
סיכום מחירי דלק לפי עיר עבור מדינה נבחרת: מחיר התחנה הזולה ביותר וממוצע 5 התחנות המובילות בכל עיר גדולה.
תחנות הדלק הקרובות ביותר לנקודה או לעיר, עם המחירים העדכניים לכל סוג דלק, ממוינות לפי מרחק. הכיסוי ברמת התחנה משתרע על פני 39 מדי…
תחנות הדלק הזולות ביותר סביב נקודה או עיר, מדורגות לפי מחיר עבור סוג הדלק שנבחר (במקרה של שוויון מנצחת התחנה הקרובה יותר). הכיסוי…
מחיר הדלק הטוב ביותר הזמין לכל נקודה שהיא באירופה, נפתר במורד סולם נסיגה בן שלוש רמות כך שקואורדינטה לעולם לא תחזור ריקה במקום שי…
טבלת השמות שמאחורי כל מוצר דלק: אוצר המילים הקנוני שלנו לסוגי דלק (diesel, premdiesel, truckdiesel, hvo, petrol92, e5, e10, super…
חניוני משאיות (14k+), מקלחות חינם, שירותים וסופרמרקטים ברחבי אירופה עם קואורדינטות. התוצאות ממוינות מהקרוב ביותר עם distance_km. …
חניוני המשאיות, ה-Autohöfe ותחנות העצירה הקרובים ביותר לנקודה או ל-city — ממוינים לפי מרחק עם distance_km, שם, קואורדינטות ו-coun…
הסופרמרקטים וחנויות המכולת הקרובים ביותר לנקודה או ל-city — ממוינים לפי מרחק עם distance_km, שם, קואורדינטות ו-country.
מקלחות החינם לנהגים הקרובות ביותר לנקודה או ל-city — ממוינות לפי מרחק עם distance_km, שם, קואורדינטות ו-country.
המסעדות הידידותיות לנהגים הקרובות ביותר לנקודה או ל-city — ממוינות לפי מרחק עם distance_km, שם, קואורדינטות ו-country.
אזורי התעשייה והלוגיסטיקה הקרובים ביותר לנקודה או ל-city (למעלה מ-3k+ ברחבי אירופה) — ממוינים לפי מרחק עם distance_km, שם, קואורד…
שערי חליפין מבוססי EUR עבור PLN, CZK, HUF, USD, GBP, CHF, NOK ו-UAH, מקור Frankfurter (ECB), זיכרון מטמון 6 שעות. ללא פרמטרים — ת…
תכנון מסלול
תוכנית מדלת לדלת לנסיעה חוצת גבול: המסלול, מעברי הגבול שעליו עם התור החי או תחזית לשעת ההגעה שלך, ועצירות המנוחה, האוכל והתדלוק ש…
זמן נסיעה + נתוני תור בגבול לכל מעברי הגבול מנקודת מוצא נתונה. מחזיר זמן נהיגה, התור הנוכחי, זמן נסיעה כולל מוערך ומרחק לכל מעבר …
הגבלות נהיגה למשאיות באירופה לפי country ותאריך, כולל איסורים עונתיים וחגים. כל איסור נושא את סוג ההגבלה שלו (General / Local / S…
תקנות פתיחת חנויות בימי ראשון, וימי ראשון הקרובים שבהם מותרת מסחר, לכל מדינה מוסדרת באיחוד האירופי.
חגים רשמיים לפי מדינות אירופיות — תאריכים, שמות מקומיים וסוג, רשימת החגים המלאה של כל מדינה כלולה. מופעל על ידי שירות Nager.Date …
לוגיסטיקה
נהגים וכבישים
דיווחים מאושרים על מצב הכביש בקרבת הגבולות ובצירים הראשיים: בורות, עבודות בכביש, חסימות, קרח ומפגעים — שילוב של דיווחי נהגים עם ז…
האם country דורשת ויניטה לנסיעה בכביש מהיר, מחירים עדכניים לפי משך ואיפה לקרוא עוד — לפי country או לנסיעה שלמה.
חנויות מפעילים סלולריים ונקודות WiFi שימושיות לנהגים בדרכים, מהקרוב ביותר לנקודה או ל-city עם distance_km.
ביצועי מעבר גבול לפי מוביל אוטובוסים: מספר מעברים, דקות המתנה ממוצעות/חציוניות/מינימום/מקסימום — מבוססים על רשומות המעבר שלנו עם …
סכנת הדרך במעבר גבול בסולם אחד 0–5: כביש נקי, ערפל, שלג, גשם, קרח או רוח חזקה — בשפה שלך, עם דרגת החומרה, גיל הנתון והמקור: נהג א…
Air-raid alerts and airborne objects near ONE border crossing. Anchor on a checkpoint (ppid), a coordinate pair or a city and get…
Your Fleet (NakBus Live)
צי ה-NakBus Live הפרטי שלכם: כל רכב הרשום לחברה שלכם עם לוחית רישוי, תווית, קו משויך, דגל מפה ציבורית, סטטוס, האם מכשיר הנהג נמצא…
היכן נמצאים האוטובוסים שלכם ממש עכשיו — שורה אחת לכל רכב פעיל עם lat/lon, חותמת זמן וגילה, מהירות, כיוון נסיעה ועיכוב לוח זמנים, …
מסלול GPS מוקלט של הרכבים שלכם: כל נקודת מיקום שנשמרה בחלון זמן נתון, בסדר כרונולוגי, עם מהירות, כיוון נסיעה ודיוק. סננו לרכב בוד…
עוזר AI
שאלו את עוזר ה־AI שלנו כל שאלה על מעבר גבול (תורים, תחזיות, כללים, דלק, מסלולים) וקבלו בדיוק את אותה תשובה מבוססת נתונים שמניעה א…
עוזר ה-AI שלכם, המבוסס על התוכן שלכם ועל נתוני הגבול החיים שלנו. תנו לנו את קובצי ה-markdown שלכם או ציינו את הדפים שנמשוך בעצמנו…
אחר
Pedestrian routes ranked by how much of the way lies in building and tree shade at the time of the walk (heat) or in sun (cold). …
Shade per H3 resolution-11 hex (about 25 m) for a small bounding box at a given time: share of open ground in building shade and …
Shade share and pavement temperature estimate of one walk for every 15-minute departure in the next hours, and the best window. P…
Places to cool a dog down near a point: safe water access on lake and river shores, bathing places, drinking water, forests, all-…
Cool spots for dogs along a walking route: every spot within the corridor with its position along the walk and the shade at the t…
Truck-accessible stops within 2 km of a route you already have: truck parkings shaded by trees (canopy share within 100 m), rest …
ייצוא נתונים היסטוריים
מפתחים מאושרים יכולים להוריד היסטוריית תורים בגבול שפורסמה, בממוצעים שעתיים, עבור עד 5 מעברי גבול (חלון נע של עד 90 יום) בפורמט CSV מכווץ ב־gzip, NDJSON או JSON. זו יכולת של הפורטל בלבד — ולא נקודת קצה של ה־API; את הייצוא בונים ומורידים מלשונית "ייצוא נתונים" בחשבון שלכם.
הגישה ניתנת לפי בקשה: פתחו פנייה מסוג Data וציינו אילו מעברי גבול, איזה טווח זמן ולאיזה שימוש. לאחר האישור מופיעה בחשבונכם לשונית "ייצוא נתונים". מגבלת ברירת מחדל: ייצוא אחד ביום, עד 5 מעברי גבול בכל אחד — בקשו מאיתנו להגדיל אותה.
שדות — שורה אחת לכל מעבר גבול לכל שעת UTC
| פרמטר | תיאור |
|---|---|
ppid | מזהה מעבר הגבול |
checkpoint_name | שם מעבר הגבול |
hour_utc | חלון שעה, ISO-8601 UTC |
direction | לדוגמה UA->PL |
vehicle_type | רכב / אוטובוס / משאית / הולכי רגל |
avg_queue_length | אורך תור ממוצע לשעה |
avg_wait_minutes | זמן המתנה ממוצע לשעה; null במקומות שבהם למעבר אין נתוני המתנה רשמיים |
sample_count | מספר התצפיות באותה שעה |
מיוצאים רק נתונים שפורסמו, והם עוברים את בדיקות החריגות ואיכות הנתונים שלנו לפני הייצוא (בלי נתוני דיווח גולמיים). כל חותמות הזמן ב־UTC. הקבצים נשמרים 10 ימים.
מקוריות: בכותרת של כל קובץ מוטבעת חתימה חתומה (sha256 + HMAC), כך שאפשר לאמת בהמשך שכל עותק הוא נתון אותנטי של nakordoni.eu ולבדוק שלא בוצע בו שינוי — גם אחרי ההורדה.
# sha256: 3f9c…   # signature: e87b…
ppid,checkpoint_name,hour_utc,direction,vehicle_type,avg_queue_length,avg_wait_minutes,sample_count
id_10,Hrushiv,2026-06-12T02:00:00Z,UA->PL,car,11,,4
מה אפשר לבנות
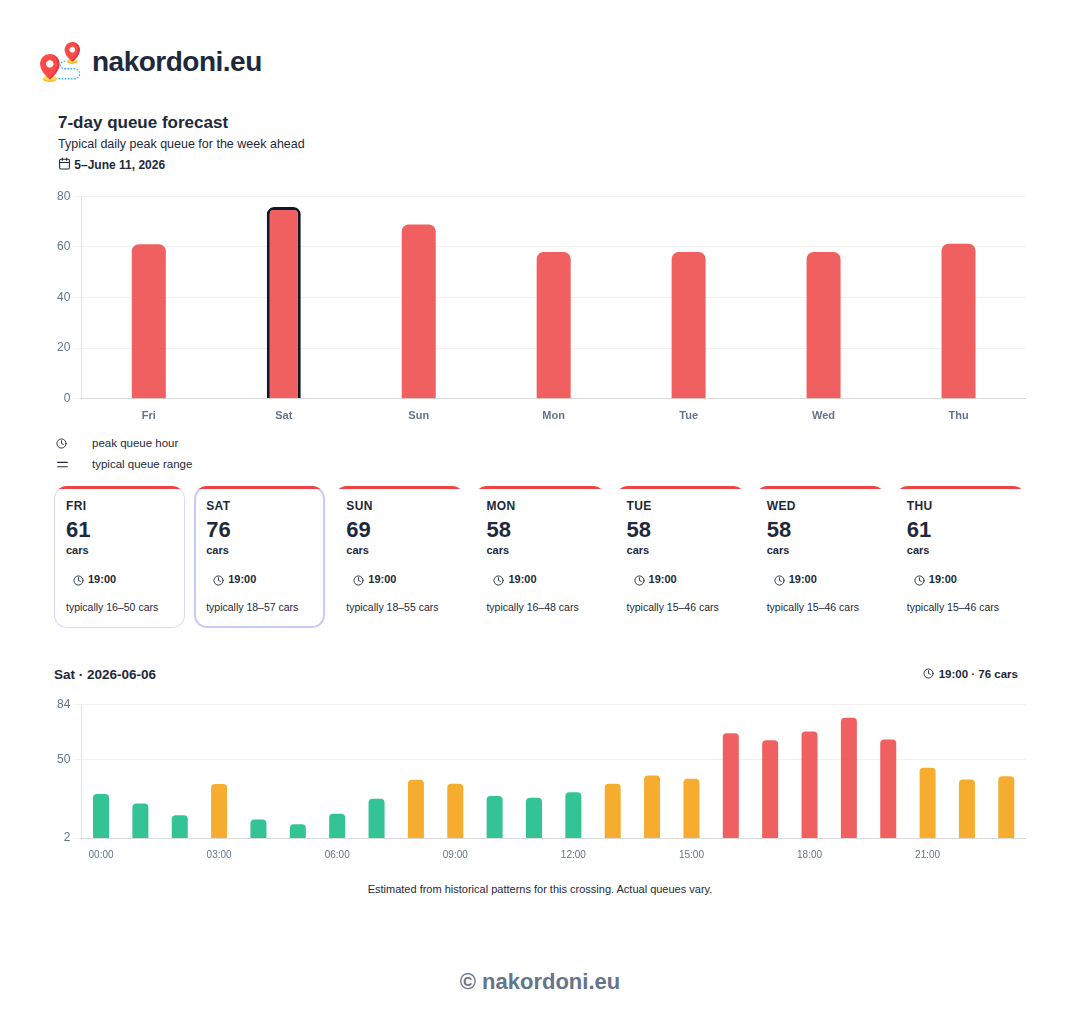
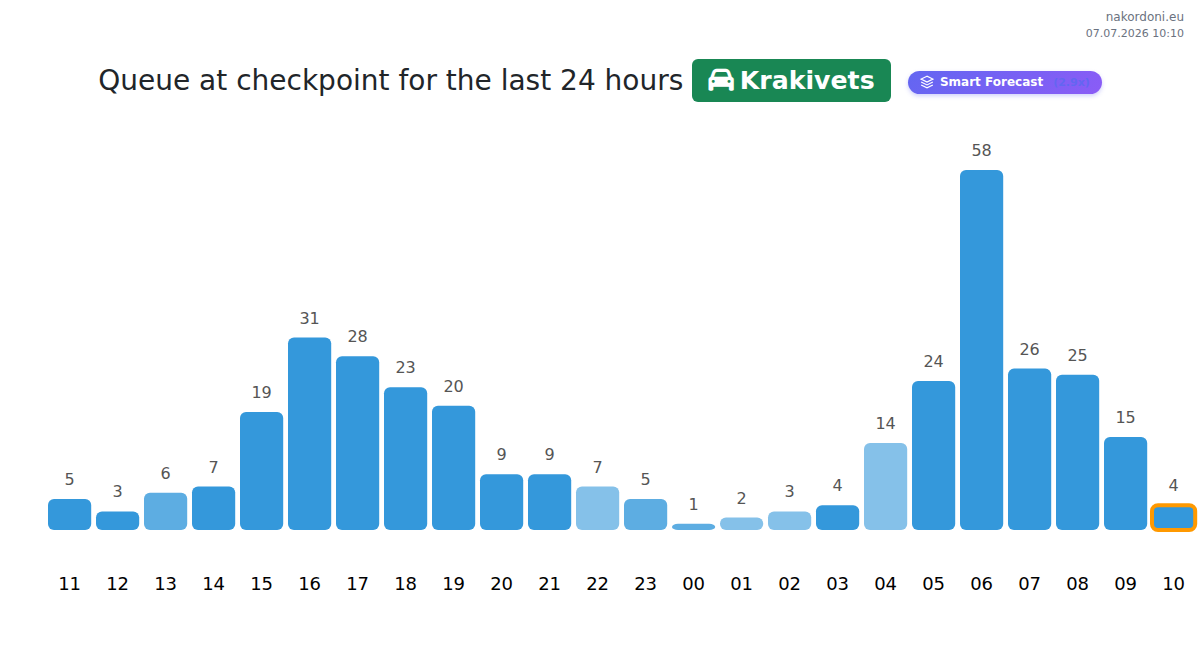
אותם מוצרי נתונים מייצרים את התצוגות ב־nakordoni.eu — גרפי תחזית שבועיים, פרופילי תור לפי שעה, כרטיסי סטטוס בזמן אמת. טעימה ממה שיש ב־API התחזיות והסטטיסטיקה:
מתן קרדיט
אינטגרציות בתוכנית Explorer חייבות להציג קישור גלוי "Data by nakordoni.eu" בכל מקום שבו מוצגים הנתונים. זה מה ששומר על התוכנית החינמית חינמית.
הקוד המדויק
העתיקו את קטע הקוד כפי שהוא. הקישור חייב להישאר ניתן לאינדוקס: <a href> HTML גלוי ופשוט ליד הנתונים, ש-Google יכול לאנדקס ולעקוב אחריו — אין להוסיף rel="nofollow", rel="sponsored" או rel="ugc" ואין להסתיר אותו באמצעות CSS. קישור שנוסף באמצעות JavaScript תקין אם הוא מופיע בדף ש-Google מרנדר (תנאי Developer API v1.0, סעיף 8.1).
<a href="https://nakordoni.eu/" title="Border queues, forecasts & statistics">Data by nakordoni.eu</a>
גרסה קומפקטית באותיות קטנות (למשל מתחת לגרף או לווידג׳ט):
<p style="font-size:12px;margin:4px 0">
  Data by <a href="https://nakordoni.eu/">nakordoni.eu</a>
</p>
אפשר לקשר גם לגרסת השפה שלך, למשל https://nakordoni.eu/he/ — כל קישור HTML רגיל וגלוי אל nakordoni.eu נחשב. טקסט העוגן "Data by nakordoni.eu" חייב להישאר באנגלית.
איפה למקם
- ממש לצד בלוק הנתונים או מתחתיו (טבלה, גרף, ווידג׳ט, תשובה) — באותו מסך, גלוי בלי קליקים נוספים.
- בכל עמוד או מסך באפליקציה שבו מופיעים הנתונים שלנו — לא רק בעמוד "אודות".
- גודל וניגודיות קריאים: לפחות ~11px, לא מוסתר, לא מקופל, ולא בצבע הרקע.
- אפליקציות מובייל נייטיביות ללא קישורי HTML: הציגו את הטקסט "Data by nakordoni.eu" במסך הנתונים, ומקמו קישור לחיץ במסך המידע/אודות.
אנו בודקים מדי פעם את הקרדיט ב"עמוד שבו נעשה שימוש בנתונים" שציינת בהרשמה. קרדיט חסר או מוסתר בתוכנית Explorer החינמית מוביל תחילה לתזכורת ולאחר מכן להשעיית המפתח. לקוחות בתוכנית בתשלום רשאים לוותר על הקרדיט.
הבדיקות מתבצעות בערך פעם בשבוע על ידי הבודק שלנו, שה-user agent שלו מכיל NakordoniComplianceBot/1.0. הוא פותח רק את הדפים שרשומים בלוח הבקרה למפתחים שלכם, אינו עוקב אחרי קישורים אחרים ומתעלם מ-robots.txt עבור הדפים האלה, כי אלה בדיוק הדפים שביקשתם שנבדוק. אם הגנה מפני בוטים או חומת אש חוסמת סורקים לא מוכרים, אפשרו את ה-user agent הזה — אם לא נצליח לפתוח דף, נכתוב לכם בפנייה.
רישיון נתונים ושווקים
מפתח ה-API שלכם מעניק רישיון לשימוש בנתונים שלנו רק במדינות שהצהרתם עליהן בעת ההרשמה. אנו בודקים כל הצהרה לפני הענקת גישה מלאה, מכיוון שהנתונים שלנו הם המוצר שלנו, ואיננו מעניקים עליהם רישיון לשווקים מבלי לדעת היכן הם יפורסמו.
- הצהירו על כל מדינה שהאתר, האפליקציה או המוצר שלכם משרתים. תוכלו לשנות את הרשימה בכל עת מהדשבורד שלכם; שינוי מחזיר את החשבון שלכם לבדיקה.
- עד לאישור השווקים שלכם, המפתח שלכם פועל במגבלות מופחתות - מחצית ממכסת תוכנית ה-Starter. זה חל ללא קשר לתוכנית שבה אתם נמצאים.
- אנו עשויים לאשר רק חלק מהמדינות שביקשת. הרשימה המאושרת, ולא זו שביקשת, היא זו המכסה את המדינות שברישיון שלך.
- פרסום או הפצה מחדש של הנתונים שלנו בשוק שלא הצהרתם עליו, או מכירתם מחדש כפיד נתונים מתחרה, מהווים הפרה של תנאים אלה ועלולים להשעות את המפתח שלכם ללא התראה.
- חלק מהתוכניות מוצעות רק באזורים נבחרים. הזמינות תלויה בשווקים שאתם מצהירים עליהם.
- ההסכם המלא הוא תנאי ה-Developer API. הם גוברים על התקציר הזה; הנוסח המחייב הוא האנגלי.
טריות הנתונים
עדכניות הנתונים תלויה בתוכנית שלך. בתגובה עצמה אין שום סימון — כל התוכניות מחזירות את אותם שדות, אותם טיפוסים ואותו מבנה תגובה.
- תוכניות בתשלום — Student, Starter, Pro ו-Pro MAX: טלמטריה חיה, ללא השהיה.
- תוכנית Explorer החינמית: תמונת מצב מ-15 עד 30 הדקות האחרונות. הפער המדויק משתנה מבקשה לבקשה.
תגובה מושהית אינה שגיאה ואינה בעיית מכסה — זו תגובה מלאה ותקפה עם מספרים ישנים יותר. שליחה חוזרת של הבקשה לא תחזיר נתונים עדכניים יותר.
אם היישום שלך זקוק לנתונים עדכניים, כל תוכנית בתשלום מחזירה טלמטריה בזמן אמת.
עודכן